
How to Optimize Google Ads — Data-Driven
My articles premiere on my WeChat account, then sync to CSDN, Zhihu and this blog. How do you optimize Google ads? Every beginner asks. However you run Google ads, what lands in the end is data. So I strongly recommend optimizing from data — not from "brand" or "user mindshare" hand-waving, which, bluntly, wastes money and time.
1. Define the analysis goal
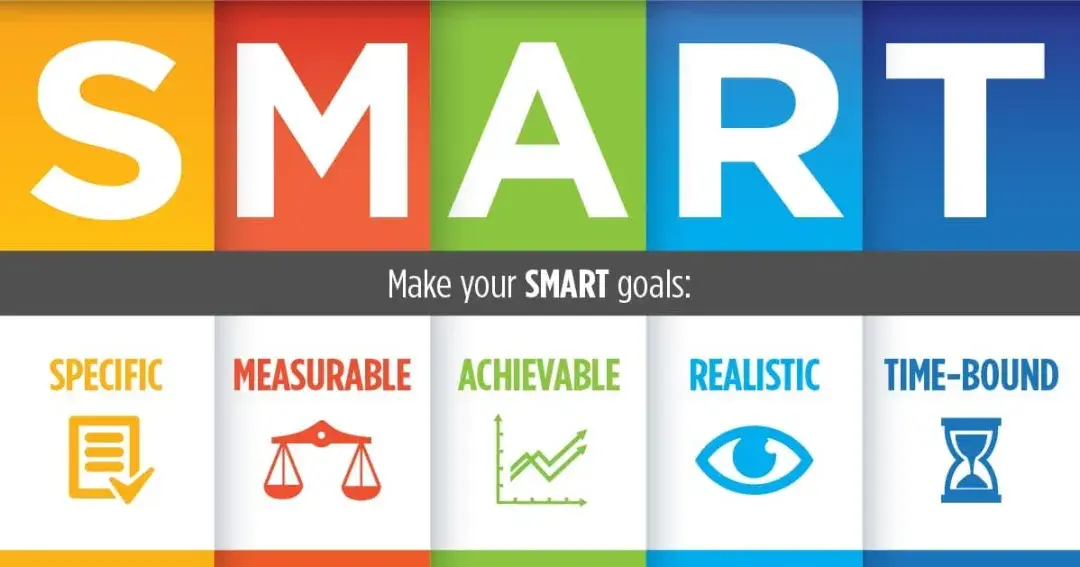
Whether something broke or the business needs mining, analysis starts with a clear goal — one satisfying the SMART principle; the S, M, A and R are mandatory.
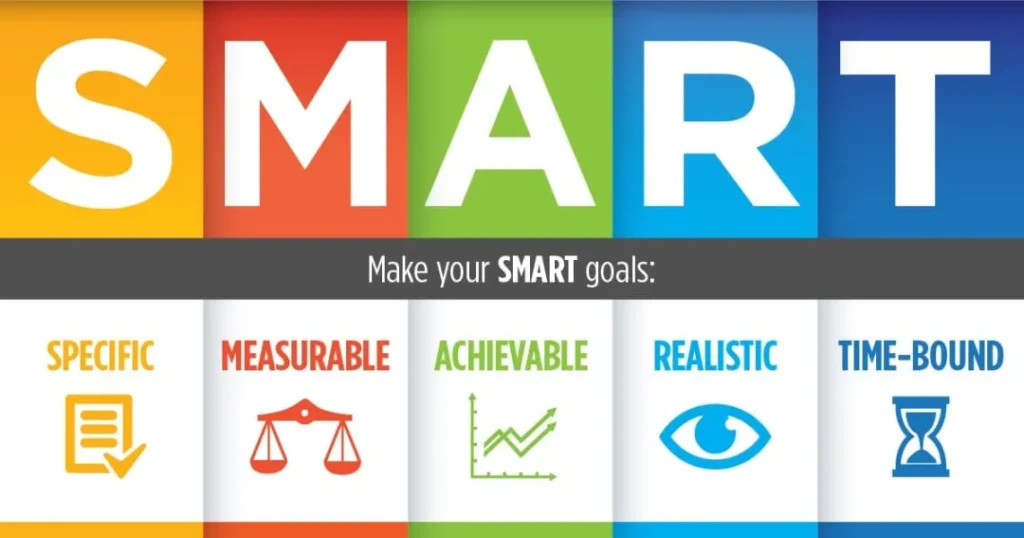
SMART goals for Google ads
If the goal isn't specific
Discuss with your manager and peers whether it can be sharpened. Example: "use ads to build a powerful brand effect." What is a powerful brand effect? What's the metric? Not specific.
If the goal isn't measurable
Assuming the goal is right, convert unquantifiable notions into metrics — typically through statistical decomposition, labeling, dimensional splits. Example: "cultivate high-potential talent." What is potential? Learning ability, imitation, synthesis, logical expression — each dimension can get its own tests and scoring.
If the goal isn't achievable
Change the frame: expand resources outward, or sort out inward what's actually doable. Example: iOS 14 cut device tracking IDs. Can we get answers from AppsFlyer externally, or fix our internal attribution? Complaining to Apple is an option too — with near-zero success probability.
If the goal isn't relevant
Blindly fixing goals around things you don't understand diverges from reality — coordinate closely with the departments, people and business lines the goal touches. Example: ads in Brazil suddenly went wild — is it something in the Brazil business? Go find out together. Overall, the goal of analysis is to use data logic to find a specific, measurable fact that is within our power to change — and our subsequent effort should influence that fact's course.
2. Start from the business process
Process idea 1: big to small
Market → whole business → channel → project → individual.
Process idea 2: MECE, pyramid principle
Work both horizontal and vertical dimensions — no overlaps, no gaps, every node connected.
Process idea 3: seize the key nodes and their blast radius
No-overlap-no-gap implies many nodes, but not every node deserves attention. Each datum influences a limited stretch of the chain; identify the key node per stage and know the range and boundary of its influence. Try the sandbox below — how would you analyze it?
Analysis sandbox
Background: my Brazil Google ads ROI spiked abnormally, ~+180%. Analysis flow:
| Layer | What to check | Status |
| Market | Whole-market volatility? | Normal |
| Site | Brazil channel volatility? | Normal |
| AF attribution | AppsFlyer attribution anomalies? | Normal |
| SEM channel | Big swings in Brazil? | Abnormal |
| SEM channel | Whole channel swinging? | Abnormal |
| SEM sub-channels | Only Google abnormal? | All of SEM abnormal |
| Brazil ops | Brazil coordination abnormal? | Normal |
| My ads | Brazil campaigns abnormal? | Normal |
Reasonable inference: market, macro, ops and ads all normal → likely AppsFlyer attribution feeding into internal data went wrong; escalate to engineering.
3. The three axes of data analysis
The industry-standard trio:
1. Compare
Compare the changed data within the same dimensions (time, country, delivery type, cycle): what exactly differs, by how much, beyond experience? Example: "temperatures fluctuate a lot lately." Compare morning-evening deltas against the historical deltas and you'll know.
2. Segment
A. With a confirmed anomaly, walk the business composition piece by piece
Example: ROI keeps falling. Check campaigns are serving, check country-level ROI trends, check actual ROAS gaps. If all clean, inspect landing pages and keywords.
B. Decompose the anomalous metric's structure
Example: a campaign's spend goes weird. Spend decomposes into time, creative, audience, keywords — split the anomalous period's structure to find which components broke, and you've found the root drivers.
3. Trace to the source
With the anomalous segment identified, trace the factors behind it. Case: October 2020, several SDS campaigns spent abnormally. Compare, segment: the split showed UK keyword spend exploding at 1 a.m. Trace: keyword analysis found 80% of spend on "iphone12", "iPhone" — utterly irrelevant keywords. Action: excluded the runaway keywords across all global campaigns, reported the anomaly to Google, investigated why those keywords triggered the ads.
4. Validate the data
After analysis delivers conclusions, two situations commonly arise:
1. Misjudgment
The actions your conclusion implies don't fix the real problem. Example: analysis finds Google's ROAS bids clearly correlate with ad ROI; in practice, raising ROAS bids doesn't necessarily lift ROI — it can lower it. This is correlation vs causation. Correlation is easy to observe; causation needs more dimensions and data to establish. It's a hard problem — which is why every analysis needs validation to test whether you misjudged.
2. Attribution is messy
As above, causality is hard precisely because outcomes have multiple causes with different ranges of influence. Analyses typically surface several high-impact factors. So: never seal the verdict immediately. Validate repeatedly through subsequent operations — first to catch misjudgment, second to measure each factor's range and weight.
5. Document everything
Keep records — documents and spreadsheets — of the data, the analysis and the validation, noting each stage's impact. It speeds up localization when things break, eases handovers, and professionalizes control of each business stage. That's the data-driven approach to Google ads optimization — really just a starting point, since these methods are the standard toolkit of research and analysis generally. In short: treat every campaign as an experiment, not as a launch that must return big. Not everyone can accept that. Great media buyers are forged with money — they know where it hurts and which doors are locked because countless ROI-1 and ROI-0.x campaigns taught them. That price tag is exactly what makes many bosses flinch.
FAQ
- How do I optimize Google Ads with a data-driven approach?
- Five steps — set an analysis goal that satisfies the SMART principle, map the business process (big to small, MECE with no gaps or overlaps, focus on key nodes), apply the three axes of analysis (compare, segment, trace to the source), validate the conclusions with data, and document everything. Treat every campaign as an experiment, not a bet that must pay off.
- How do the three analysis axes work in practice?
- Compare — check whether changes exceed expected ranges within the same dimension (time, country, placement, cycle). Segment — break the anomaly down by business or data structure. Trace — find the root cause: in one case UK keyword spend spiked at midnight, and a breakdown showed 80% of it going to iPhone-related terms irrelevant to the ads, so the terms were excluded globally and reported to Google.
- Why must analysis conclusions be validated?
- Two traps — misjudgment, because correlation is not causation (ROAS bids correlate with ROI, yet raising the ROAS bid can lower ROI), and messy attribution, since multiple causes with different scopes drive one outcome. Never treat a conclusion as final without repeated validation in follow-up actions.
- How do I set a sound goal for ad analysis?
- Meet the S, M, A and R of SMART — discuss until vague goals become specific, quantify unmeasurable ones with analytical or labeling methods, rescope unachievable ones by borrowing outside resources or trimming inward, and coordinate with strongly related teams when relevance is unclear.